Hematopoiesis Intercellular Signaling Explorer (HISE)
Welcome to HISE, a website developed by the Lu Lab at USC to display putative interactions between hematopoietic stem and progenitor cells and their microenvironment at the single-cell level! We provide a few starting points in the left menu, or continue on this page to read more about the data used and how predictions were made.
Intercellular Signaling Predictions
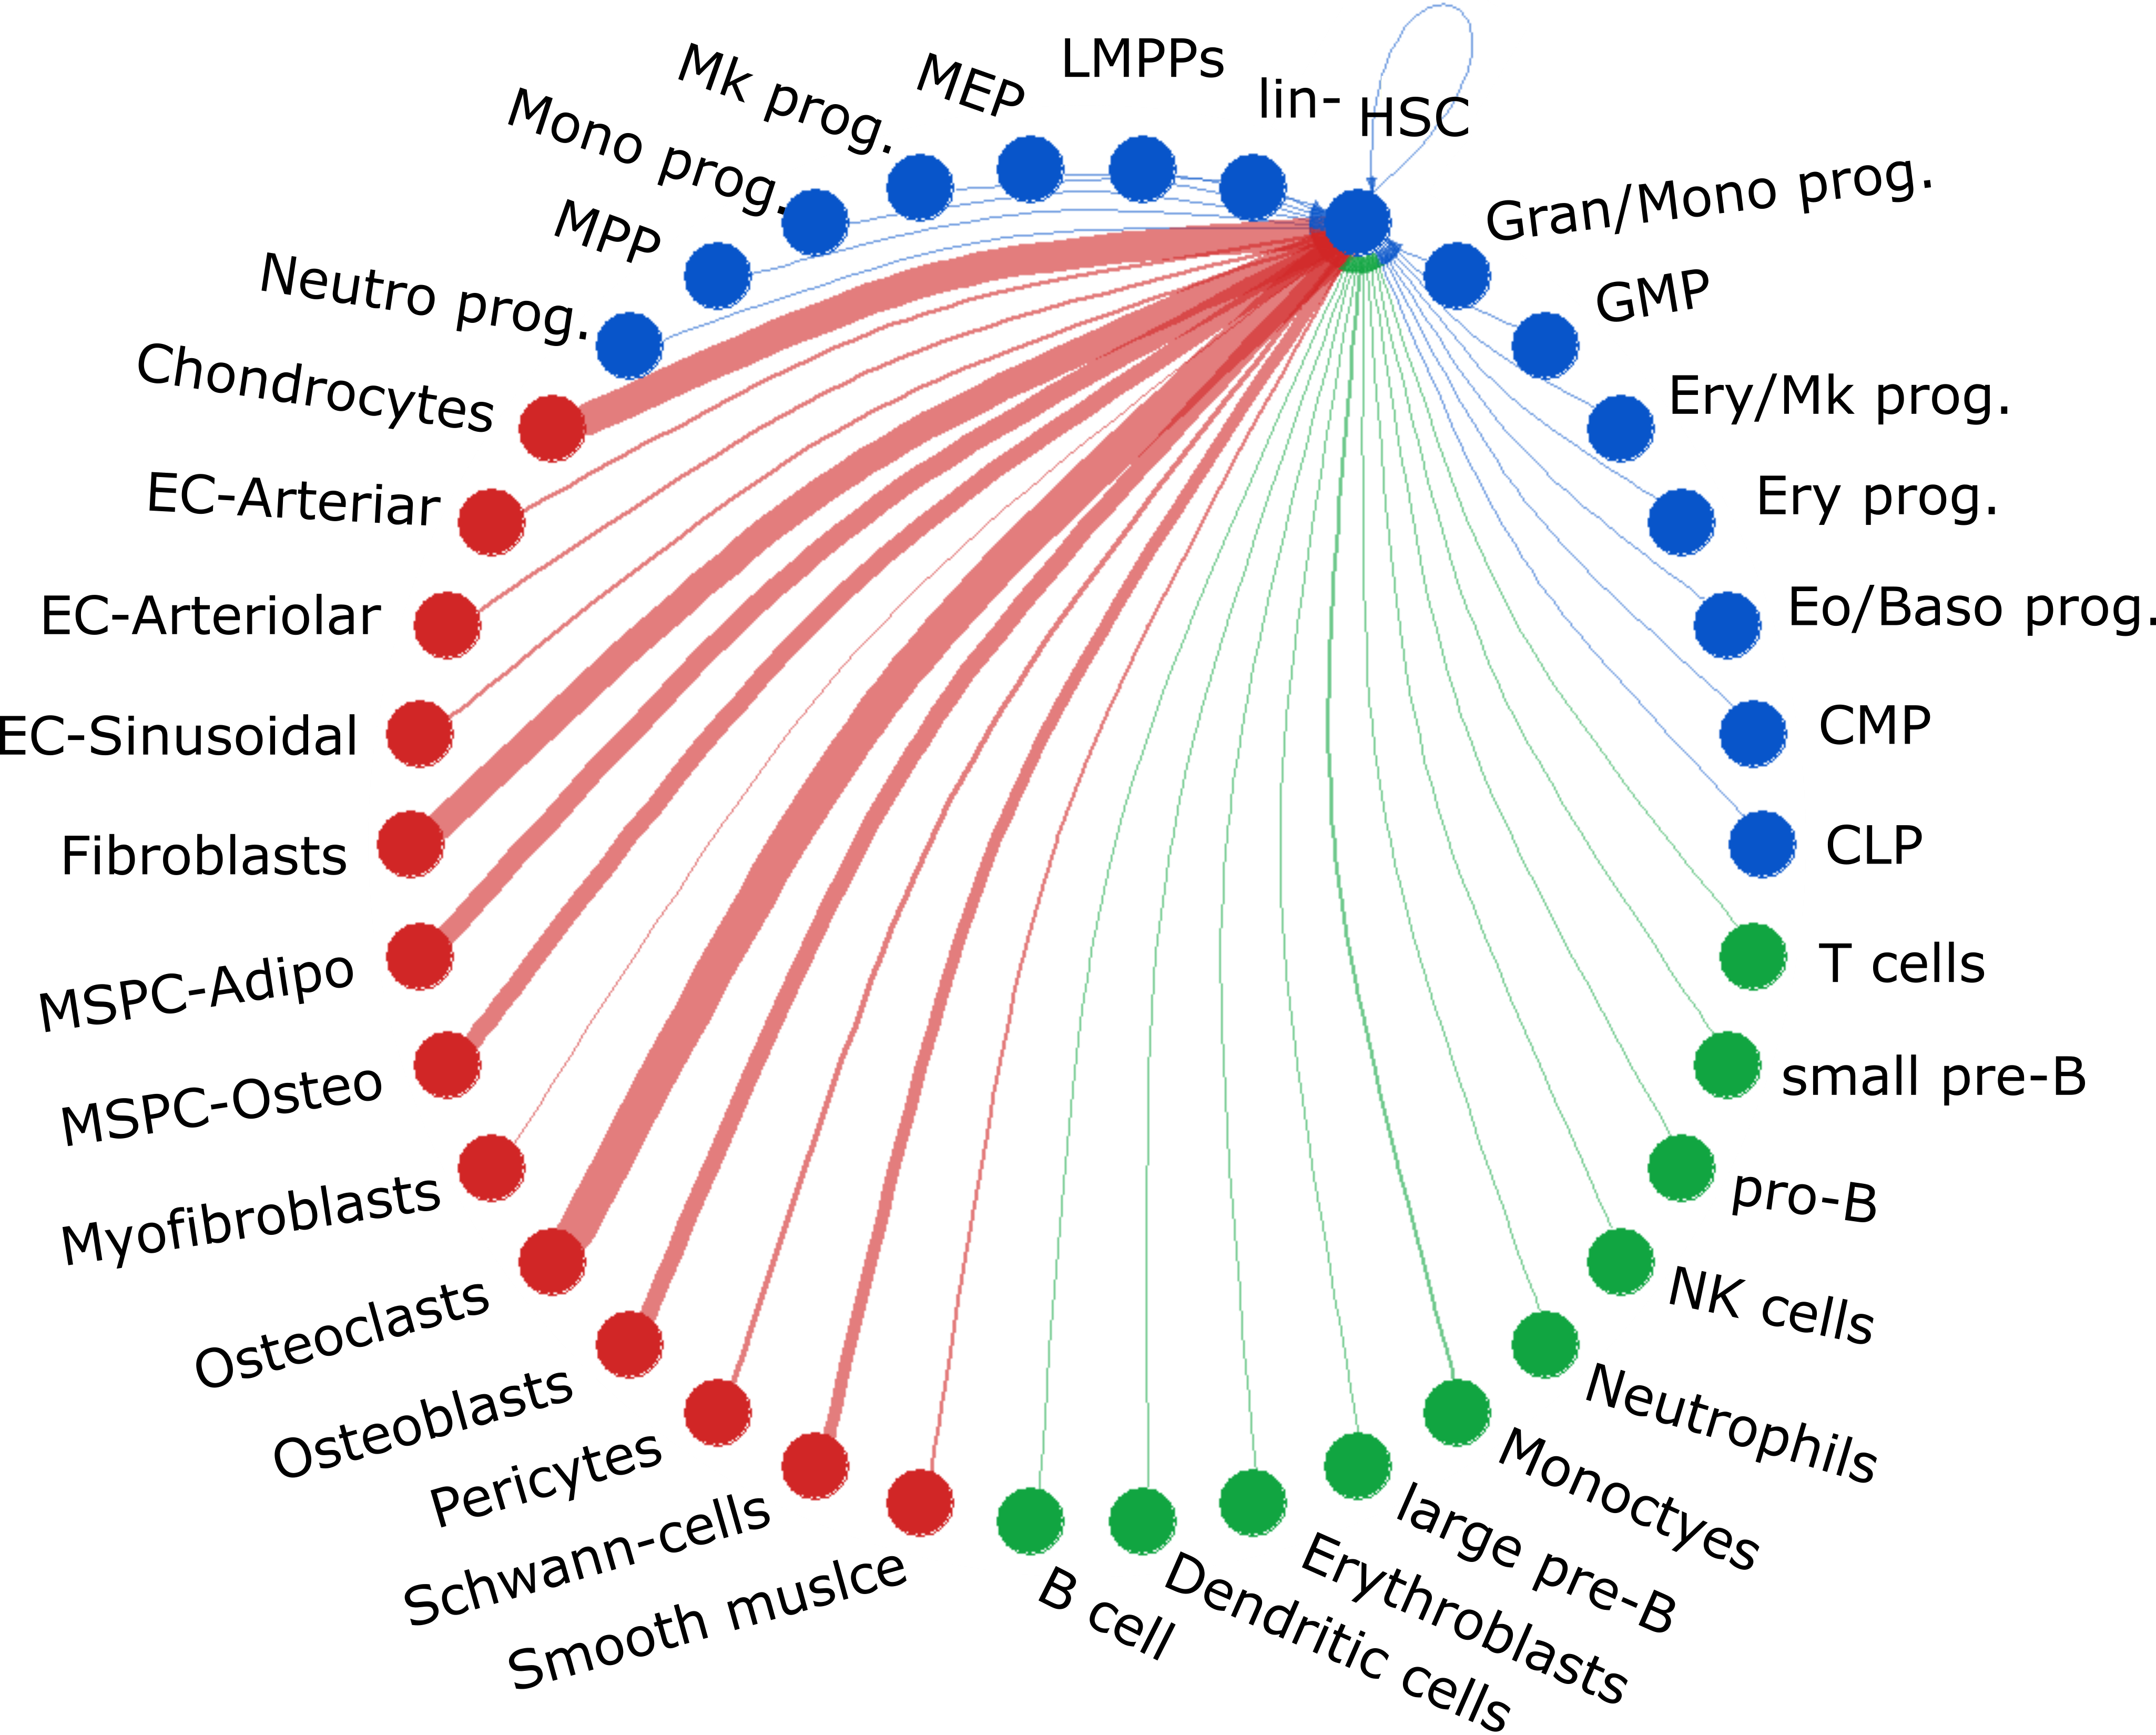
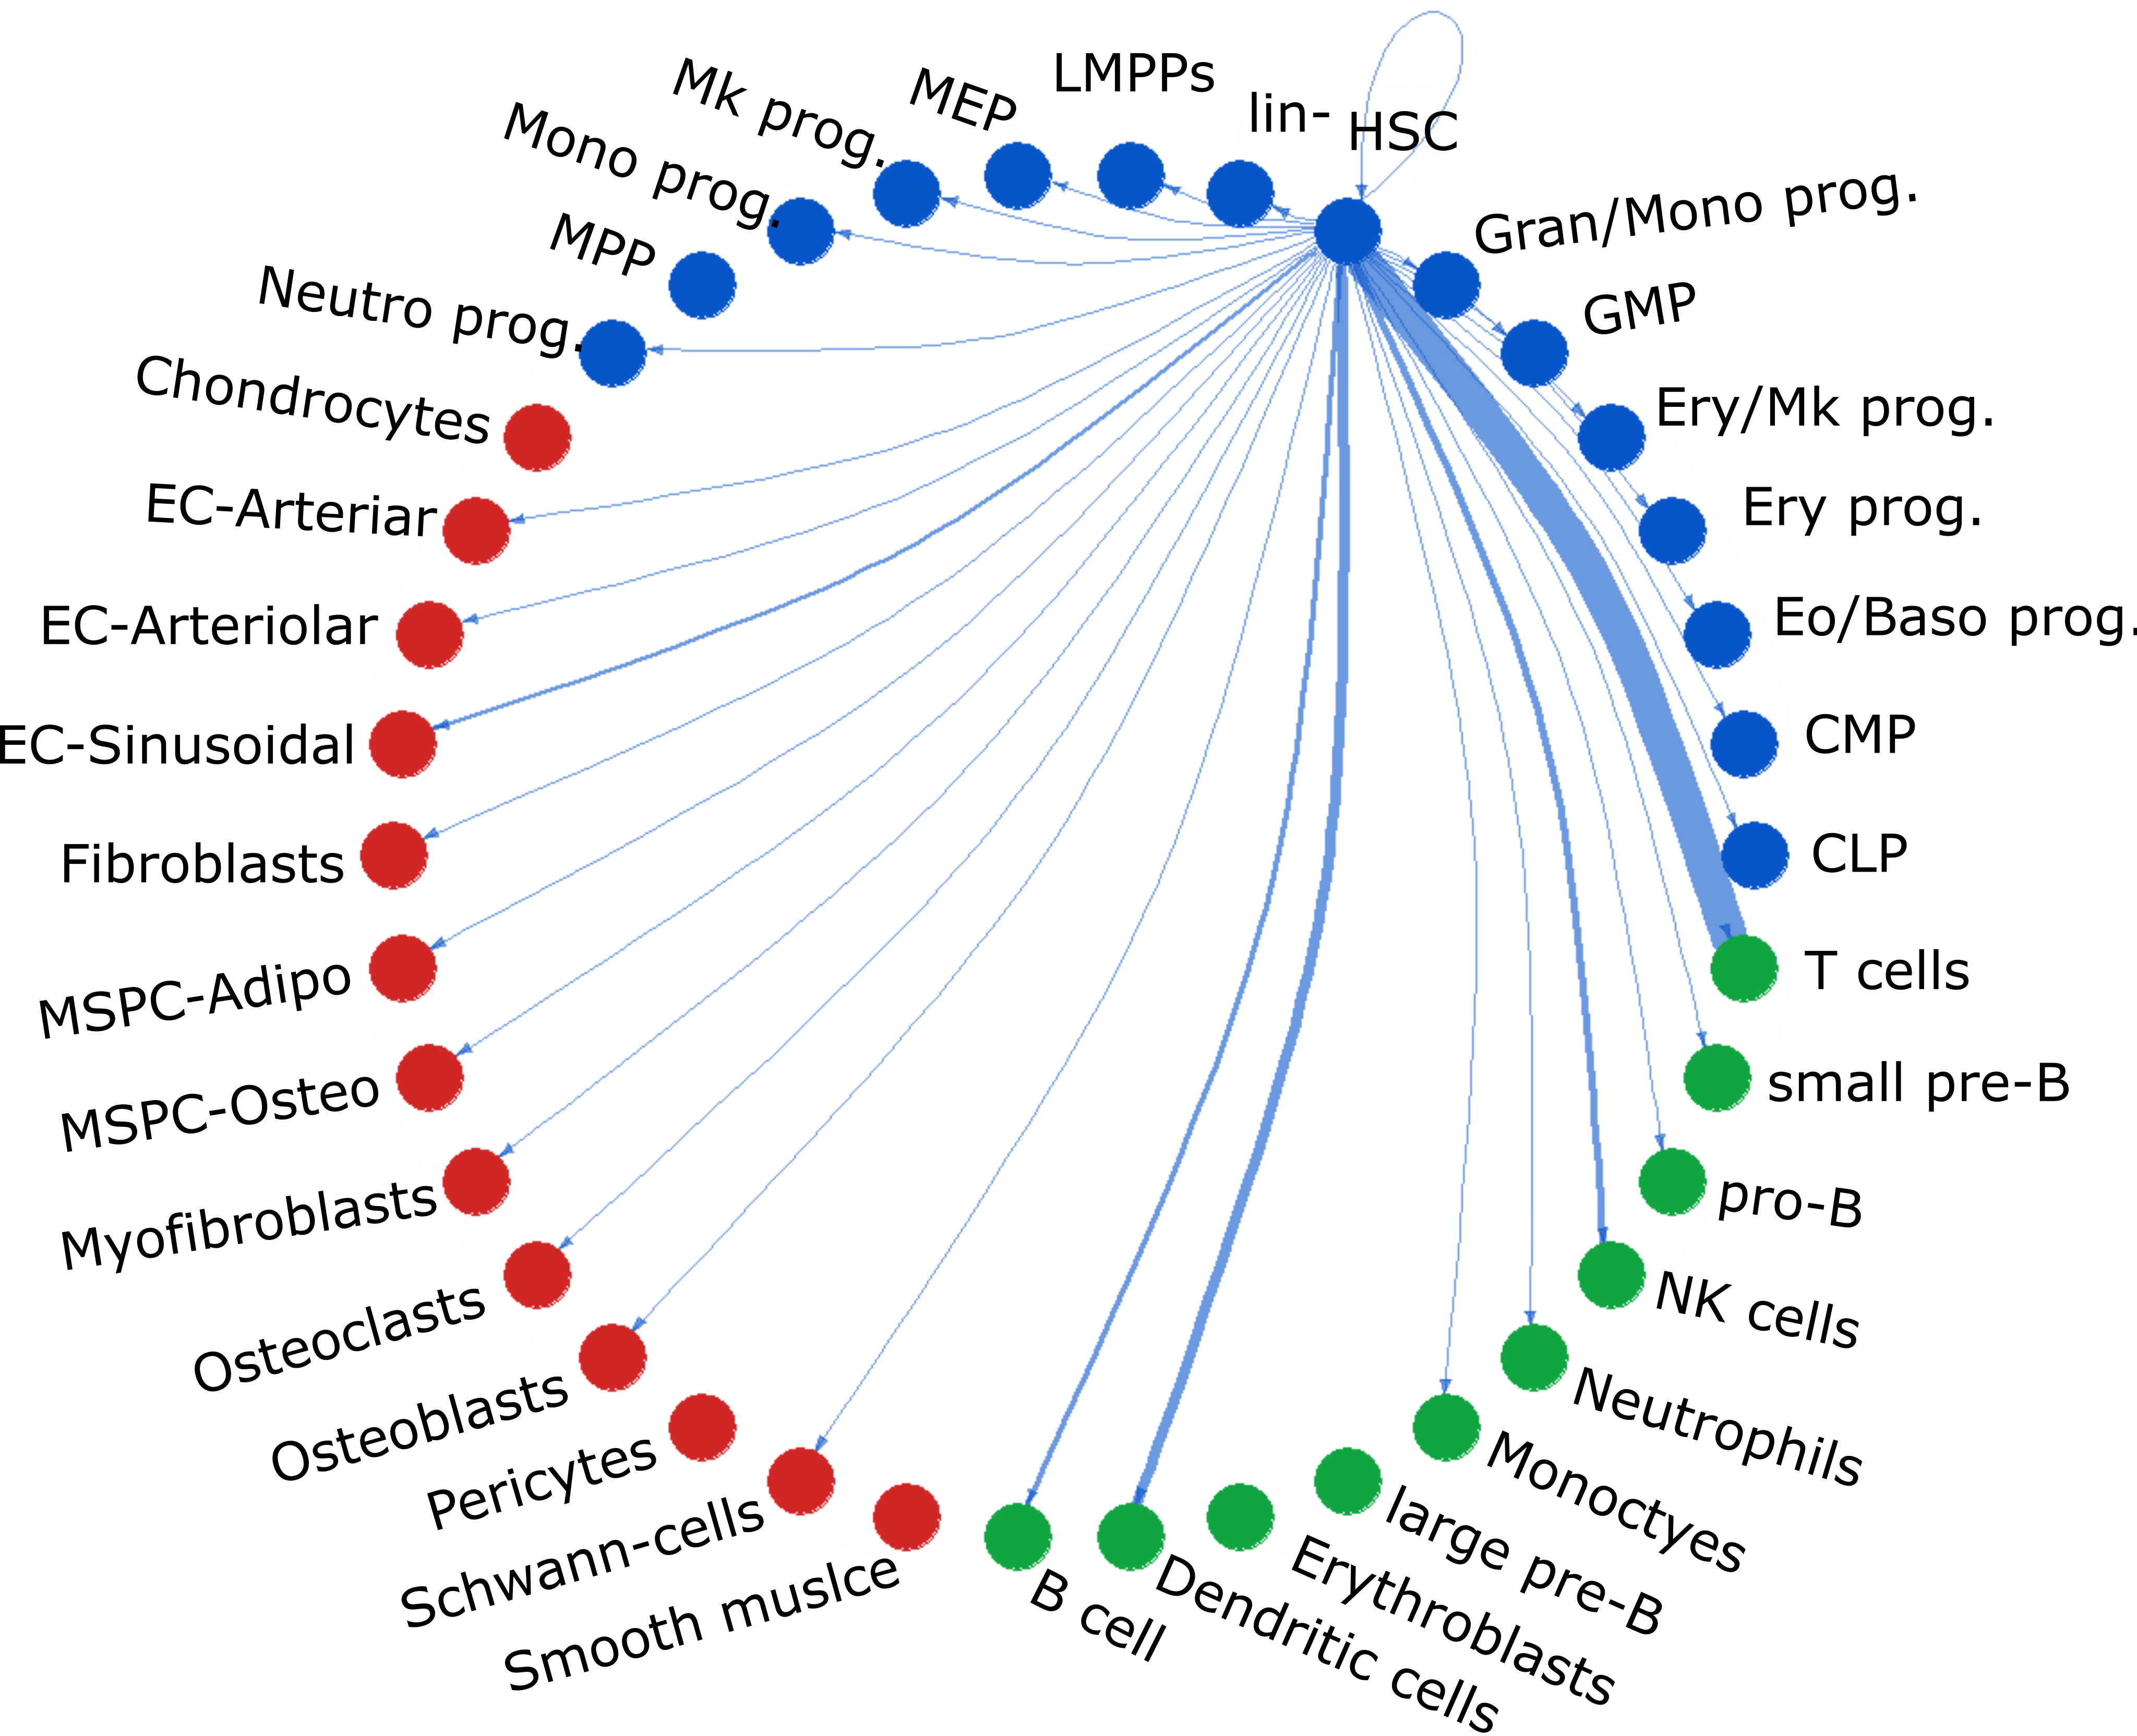
Using CellChat (Jin, et. al), individual HSPCs were treated as
distinct populations and their intercellular communications with their microenvironment were predicted. These predictions are based on scRNA
expression of corresponding ligands and receptors in the source and target cells, respectively. These generated thousands of
Pathway-Cell Type Pairs with at least 5% single-cell activity. The Pathway-Cell Type Pairs were also used to generate
pathway-pathway correlations. These correlations were calculated using Spearman rank correlations.
This calculation however does not include any spatial or cell type frequency information. See Signaling Networks for more information.
Data Sources
Single-cell RNA-seq data for hematopoietic stem and progenitor cells were collected in the lab. Single-cell RNA-seq data for non-hematopoietic cells comes from Dolgalev & Tikhonova. Single-cell RNA-seq data for blood and immune cells comes from Baccin, et. al. The number of pathways, cell types, and genes used are as follows:
- Non-hematopoietic: 13
- Blood & Immune: 10
- Hematopoietic Progenitor Cells: 15
- Secreted Signaling: 142
- Cell Cell Contact: 74
- Extracellular Matrix-Receptor: 15
- Positive Correlations: 28731
- Negative Correlations: 12137
Help
See the About page for more information.
Summary Table
Click on a column name to sort| HSPC Type | Communication Type (HSPCs are...) | Pathway Type | Cell Type | Pathway Name | Interacting HSPC Fraction | Interaction Intensity |
|---|---|---|---|---|---|---|
| CLP | Source | MHC-I | T cells | Cell-Cell Contact | 1.000 | 1.100 |
| HSC | Source | MHC-I | T cells | Cell-Cell Contact | 1.000 | 1.083 |
| CMP | Source | MHC-I | T cells | Cell-Cell Contact | 1.000 | 1.072 |
| MEP | Source | MHC-I | T cells | Cell-Cell Contact | 1.000 | 1.072 |
| GMP | Source | MHC-I | T cells | Cell-Cell Contact | 1.000 | 0.823 |
| MPP | Source | MHC-I | T cells | Cell-Cell Contact | 1.000 | 0.822 |
| CLP | Target | COLLAGEN | Chondrocytes | ECM-Receptor | 1.000 | 0.577 |
| CLP | Target | THBS | Fibroblasts | ECM-Receptor | 1.000 | 0.527 |
| CLP | Target | THBS | Chondrocytes | ECM-Receptor | 1.000 | 0.436 |
| CMP | Target | THBS | Fibroblasts | ECM-Receptor | 1.000 | 0.418 |
| HSC | Target | THBS | Fibroblasts | ECM-Receptor | 1.000 | 0.395 |
| MEP | Target | THBS | Fibroblasts | ECM-Receptor | 1.000 | 0.391 |
| GMP | Target | THBS | Fibroblasts | ECM-Receptor | 1.000 | 0.390 |
| MPP | Target | THBS | Fibroblasts | ECM-Receptor | 1.000 | 0.379 |
| CMP | Target | COLLAGEN | Chondrocytes | ECM-Receptor | 0.996 | 0.352 |
| CMP | Target | THBS | Chondrocytes | ECM-Receptor | 1.000 | 0.348 |
| HSC | Target | COLLAGEN | Chondrocytes | ECM-Receptor | 0.996 | 0.336 |
| HSC | Target | THBS | Chondrocytes | ECM-Receptor | 1.000 | 0.329 |
| GMP | Target | COLLAGEN | Chondrocytes | ECM-Receptor | 0.993 | 0.328 |
| MEP | Target | THBS | Chondrocytes | ECM-Receptor | 1.000 | 0.326 |