Signaling Pathway Correlations
How Correlations were Calculated
Spearman rank correlations at the single cell level were calcualted across all cell type-pathway pairs (i.e. HSC source T-cells MHC-I target).
Correlations were filtered such that pathways in a pair shared no functional genes.
They were then filtered such that their adjusted p-value < 0.05. These correlations were then collapsed to pathway level correlations by
averaging their cell type-pathway pair correlations and taking the best adjusted p-value.
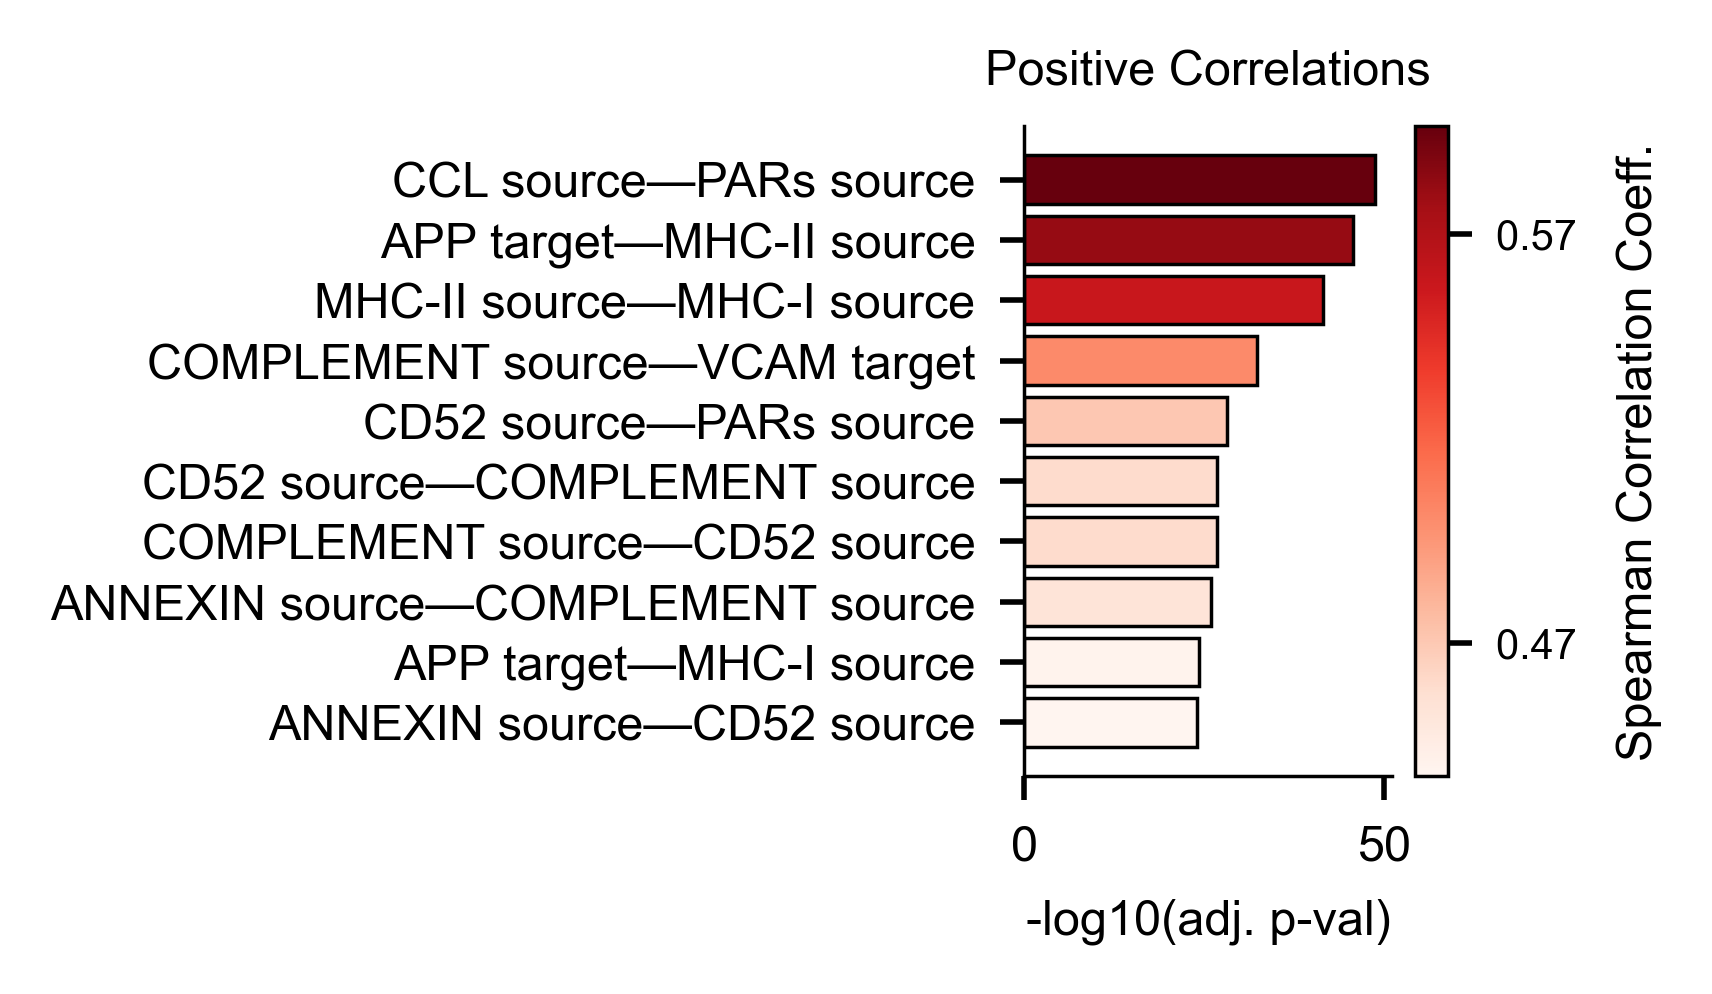
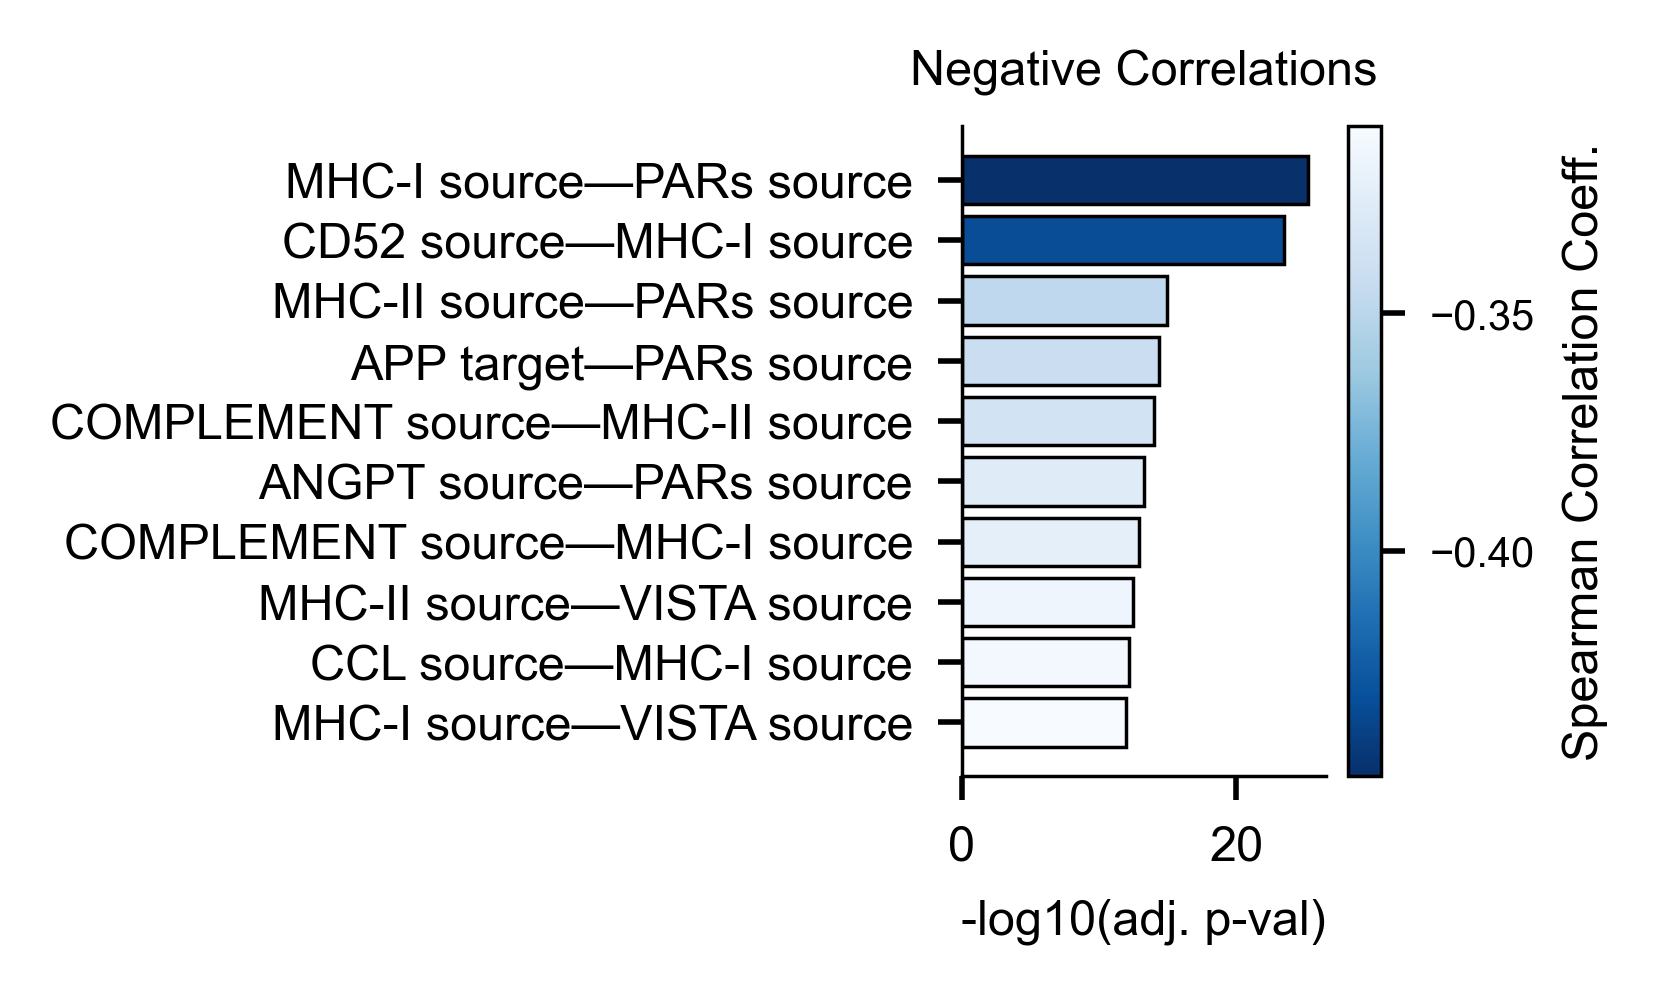
As an example, the top 10 positive and negative pathway correlations for HSCs are shown below. Here, the highest positive correlation in HSCs is between HSC CCL source and HSC PARs source (r = 0.736). The highest negative correlations in HSCs is between HSC MHC-I source and HSC PARs target (r = -0.403).
Most Positive Correlated Pair: send MHC-II and send MHC-I
Most Negative Correlated Pair: send MHC-I and send CD52