About HISE
Hematopoiesis Intercellular Signaling Explorer (HISE) is a database tool for exploring intercellular communication patterns of hematopoietic stem cells in the mouse bone marrow at the single-cell level. To start exploring, we provide four starting points: Bone Marrow Cell Types, Signaling Pathways, Pathway Correlations, and Genes.
Selecting an HSPC
On the Cell Types, Pathways, and Pathway Correlation pages, you will be met with a menu on the left hand side prompting you to "Select HSPC Type". Selecting an HSPC will reload the page to display interaction data using the selected cell (interacting fraction, intensity, pathway correlations, etc.).
Selecting a Correction Factor
On the Pathways page, you will be met with a menu on the left hand side beneath the HSPC menu prompting you to select a "Cell-Cell Signaling Value". Selecting a correction (default "Signaling Potential") will reload the page to display interaction data using the selected correction. These corrections come from flow cytometry of bone marrow (bone marrow proportion) and Phenocycler measurement of spatial organization in the mouse bone marrow (spatial enrichment). As these are applied to interacting cell types, this correction is only offered on the Pathways page, however, the correction factors are provided on the Cell Types page as well.
Specificity Index
On the Pathways page, you will see a "Specificity Index" noted for HSPCs as a target and HSPCs as a source for that specific pathway. This is a value between 0 and 1, that quantifies how specific this pathway is for HSPCs compared to all other mouse cell types from other tissues, with 1 being most specific to HSPCs. This value was calculated based on percentile rank of interacting genes for each pathway. Some pathways do not have this information. This is due to missing gene data for some pathways.
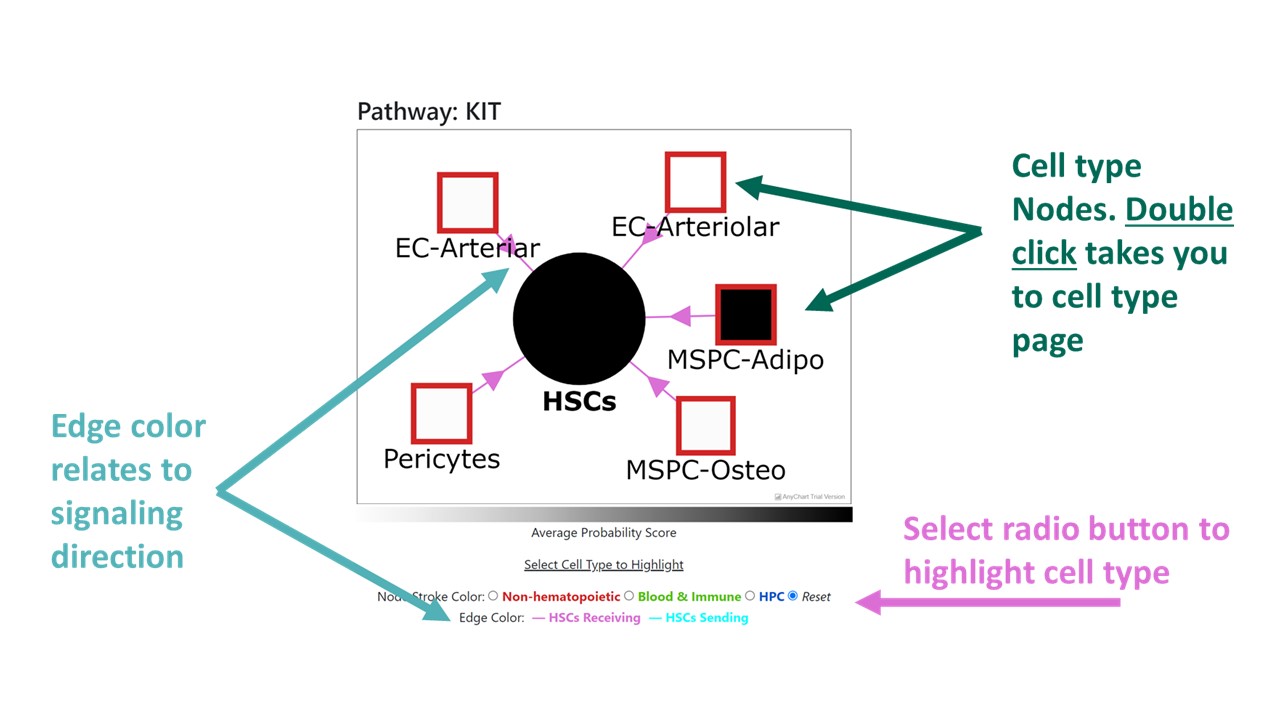
Bone Marrow Cell Types
Cell types are split into three categories: non-hematopoietic, blood and immune, and HPCs. Selecting a cell type from the dropdown menu takes you to a page that displays the details of that cell type. These details include: the pathways the given cell type is involved in with the selected HSPC (left menu), and a plot to visualize the pathways, fraction of single cells and interaction scores for the given pathway.
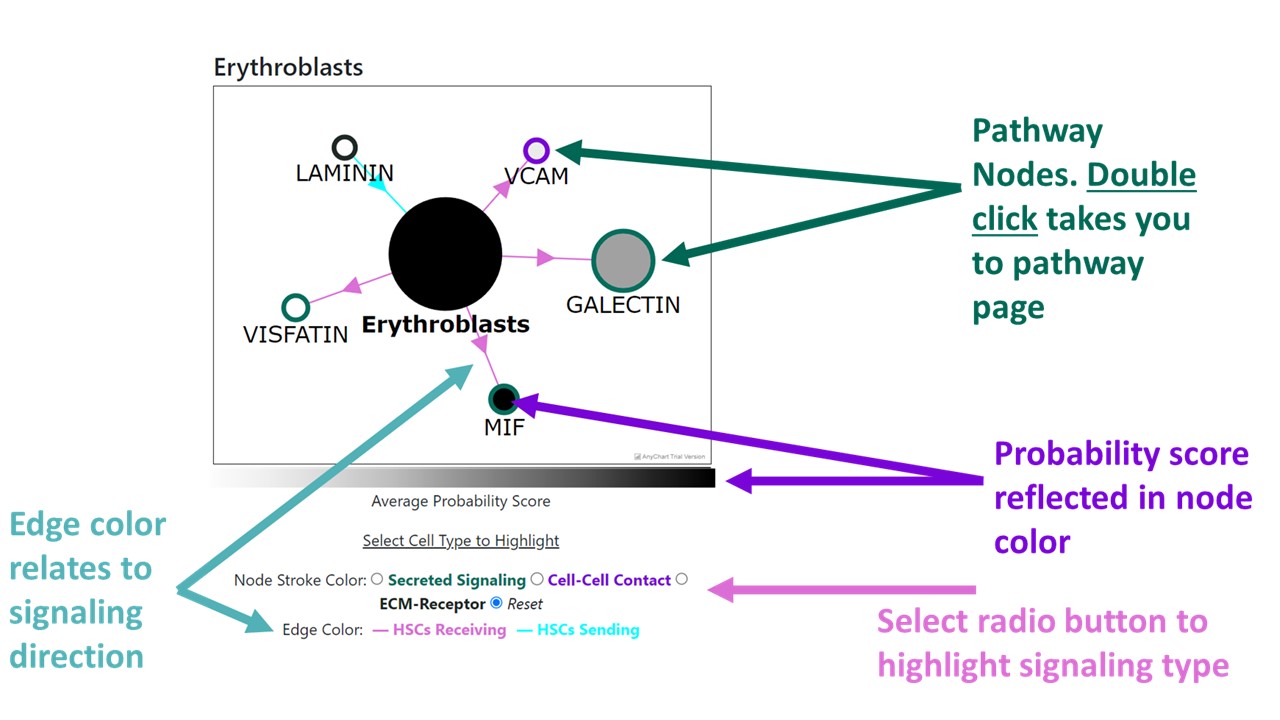
Signaling Pathways
Like cell types, pathways are split into three categories: secreted signaling, cell-cell contact, and ECM-Receptor. Selecting a pathway from the dropdown menu takes you to a page that displays the details of that pathway. These details include: the pathway's ligands and receptors, the cell types that participate in the pathway with selected HSPC, and a plot to visualize the fraction of single cells and interaction scores for the given pathway. This page also links relevant information regarding the pathway and evidence of its ligand-receptor pairs under "Details on the ___ pathway".
Pathway Correlations
Spearman rank correlations at the single cell level were calcualted across all cell type-pathway pairs
(i.e. HSC source T-cells MHC-I target). Correlations were filtered such that pathways in a pair shared no functional genes.
They were then filtered such that their adjusted p-value < 0.05. These correlations were then collapsed to pathway level correlations by
averaging their cell type-pathway pair correlations and taking the best adjusted p-value.
The Pathway Correlations page displays a heatmap of correlations where the rows and columns are pathways
and the color of the cell shows the Spearman Rank Correlation. Only significant correlations are displayed.
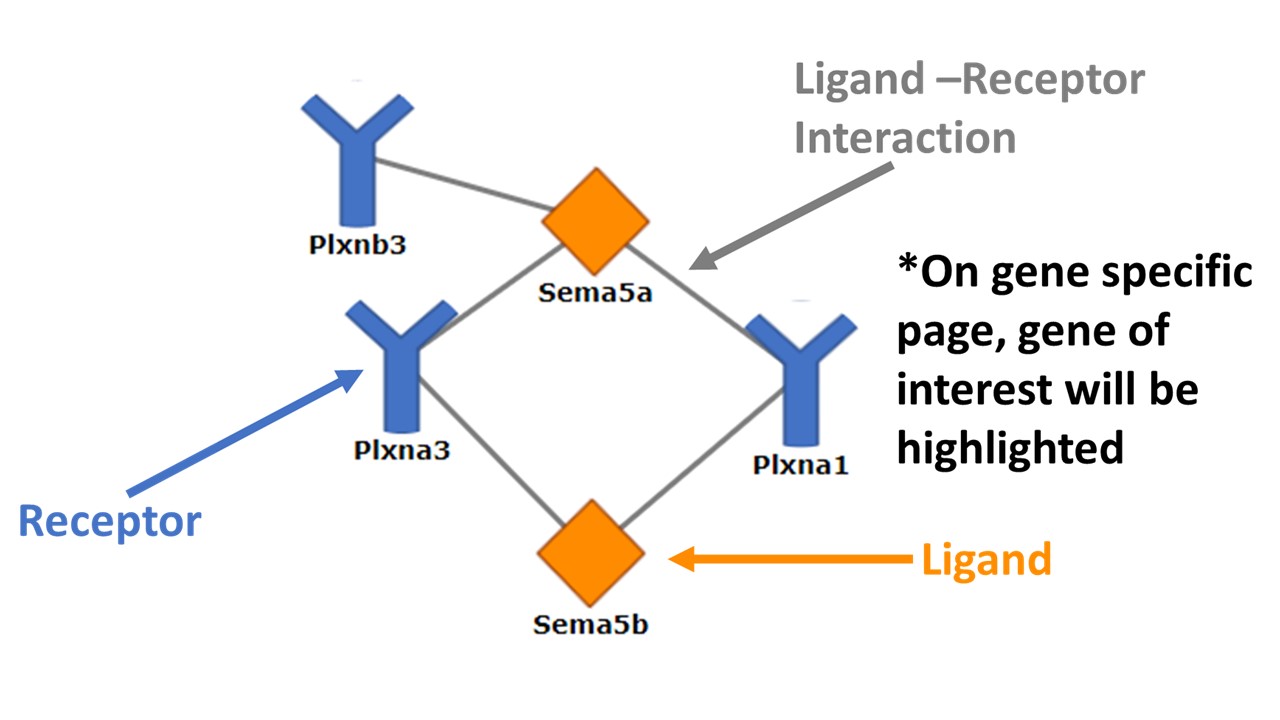
Genes
Genes are split into two groups, ligands and receptors. Selecting a gene from the dropdown menu takes you to a page that displays the details of the gene. These details include: the corresponding ligand or receptor, the pathways it is included in, a link to literature reference supporting the ligand-receptor pair and pathway, and a link to the corresponding Gene Expression Commons information page (Gene Expression Commons).
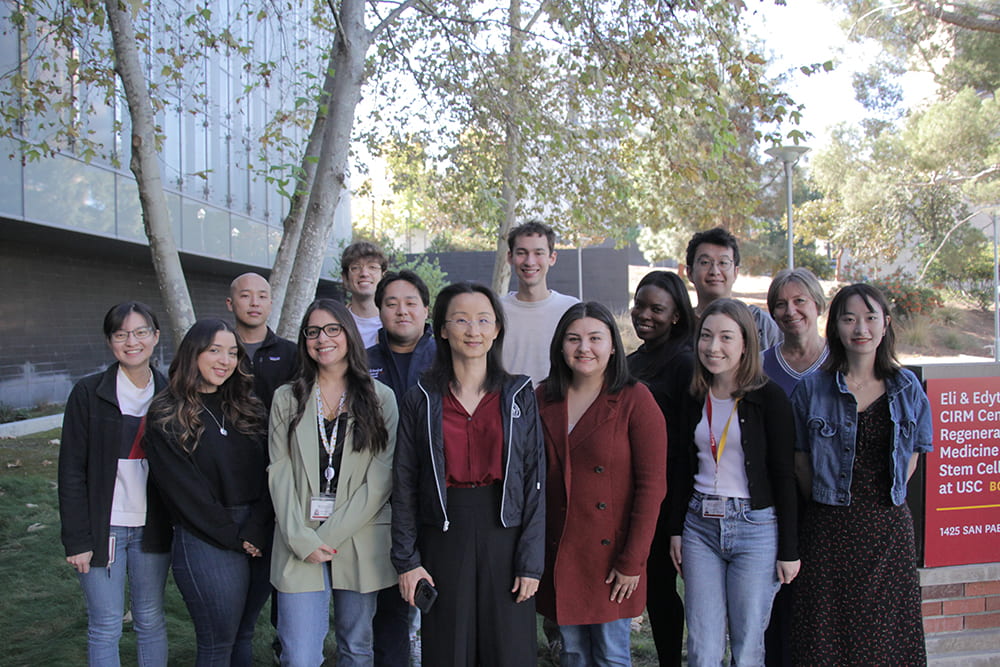
Lu Lab
This database was designed and deployed by the Rong Lu Lab at the University of Southern
California. Click here for more
information about our group.